Earlier this year I documented
seasonal moves in the prices of gold and oil over the past 20 years, copper over
13 years, and the Toronto Venture Exchange Index over 14 years (Mercenary Musings:
January 4
;
March 28
;
April 11
;
June 13
).
I now present our research on
the seasonality of the Baltic Dry Index (BDI). In this case, we obtained data from 2003 to 2016. In a series of
normalized charts, we will show that for bull, bear, and overall market
conditions, there are predictable intra-year trends in the value of the Baltic
Dry Index.
Many lay investors may not be
familiar with the Baltic Dry Index; therefore, I offer a brief explanation:
The BDI measures the current
price of moving raw materials by sea. It is posted five days a week, exclusive
of holidays and from Xmas until the first work day of the New Year.
The Index is compiled and
posted by the Baltic Exchange of London and covers four different sizes of bulk
cargo ships on 23 shipping routes throughout the world.
The Baltic Exchange has a
long history. It was founded in 1744 by a group of merchants and traders in a London
coffee house and called the “Virginia and Baltick”, reflecting England’s major
sources of international commerce at the time. By 1823, it consisted of a
merchant committee that regulated trade and operated a securities exchange from
a local tavern. It admitted the London Shipping Exchange as a member in 1900
and organized as a private limited company with shareholders. In 1992, its
iconic building was destroyed by an Irish Republican Army bomb. In early
November of this year, the Baltic Exchange was acquired by the Singapore
Exchange in a friendly transaction.
The Exchange consists of over
600 member firms and is the world’s only source of maritime market information for
the trading and settlement of physical and derivative shipping contracts.
The Baltic Dry Index was
started in 1985 and surveys a panel of international shippers on a daily basis
for assessments of rates. It is a weighted index that considers shipping routes
and volumes for the four different categories of cargo ships. BDI covers 100%
of bulk dry cargo in transit on the world’s oceans but does not include ships
transporting freight via container or transport of energy liquids by tanker.
The largest bulk cargo ships
carry over 100,000 dead weight tonnes and are called “Capesize” because they
are too large to enter the Panama or Suez Canals; i.e., they must travel around
the southern capes of South America and Africa. These ships, which can reach up
to 400,000 tonnes capacity in Southeast Asia, handle 62% of the world’s bulk
dry cargo, mostly iron ore and coal.
Other sizes of bulk dry cargo
ships include: Panamax, which carry from 60,000 to 80,000 dead weight tonnes,
and handle about 20% of world cargo; Supramax from 45,000 to 59,000 tonnes, and
Handysize from 15,000 to 35,000 tonnes. The latter two carry of 18% of annual
world cargo.
BDI is a direct measure of
the supply of dry bulk carriers versus demand for shipping capacity. The supply
part of the equation, consisting of about 9000 vessels worldwide, is tight and
inflexible. Unlike oil tankers, it is costly to park and idle a cargo ship, and
new ships take two years to build. Because of fluctuating world and regional demand,
the Index can be wildly volatile on both the upside and downside.
The Index indirectly measures
global supply and demand for metallic ores, coal, grains, steel, and industrial
and agricultural minerals. Because 95% of the metal mined worldwide is iron ore,
the Index is dominated by this commodity. Coal (both coking and thermal) is the
second most important material contributing to the Index. Copper and bauxite are
other metallic ores of consequence; steel, timber, and cement are important
construction materials.
BDI is a “leading economic indicator”
in that it measures the transportation cost of raw materials used for production
of finished goods. Therefore, it is an important input in predicting short-term
economic activity.
There is no speculative
component in the Baltic Dry Index because freighters are contracted only if
there is cargo to move. That said, there is a freight derivatives market
operated by the Baltic Exchange and administered by brokers that allows principals
and traders to lock-in or hedge freight rates via futures contracts. These
derivatives are collectively called “forward freight agreements”.
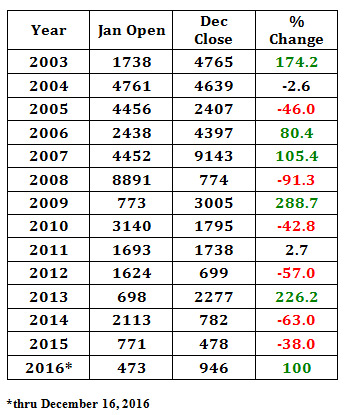
This is the daily record of
the BDI from the beginning of 2003 thru December 16, 2016:
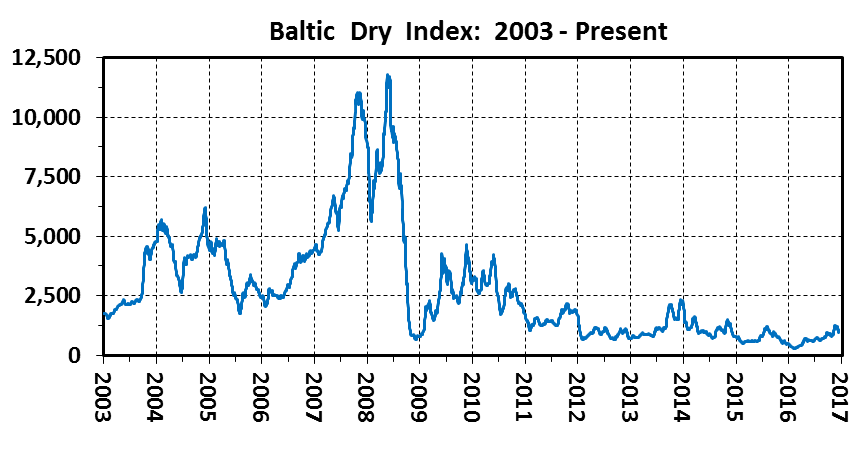
The Baltic Dry Index has
exhibited extreme volatility over the past 14 years with rises and falls
broadly corresponding to bull and bear markets for industrial commodities.
BDI’s all-time high of 11,793
was reached on May 20, 2008 in the second of two parabolic spikes when
commodity prices peaked. By December 5 of that year, it had plunged to a
post-1986 low of 663 for a 94% decline as commodities demand crashed amid the
global economic crisis.
From early 2012 to Q3 2016, a
deep bear market for commodities resulted in the Index trading well-below its
previous low. Its all-time bottom of 290 occurred on February 11 of this year
due to severely depressed demand for iron ore and coal and a glut of carriers.
Since that time, BDI has
moved sharply upward as the commodities sector enters an incipient bull market
cycle. It reached 1257 on November 18 but is currently trading in the mid-900 range
as cargo shipping reaches its usual year-end lull. The 25% decline over the
past month attests to the Index’s volatility.
Economic factors that
influence movements of the BDI include:
-
·
Supply, demand, and
prices of bulk dry commodities.
-
·
Vessel supply and
capacity.
-
·
Crude oil prices
and the resulting cost of bunker fuel.
-
·
Seasonality in
the transport of commodities.
-
·
Port congestion
and choke points including straights, channels, and canals.
-
·
Health of the
world’s economy and overall market sentiment.
-
·
Geopolitical events,
labor issues, weather, and accidents in exporting and importing countries.
The following series of four charts
shows percent change in the daily value of the Baltic Dry Index normalized to
January 1 for each year:
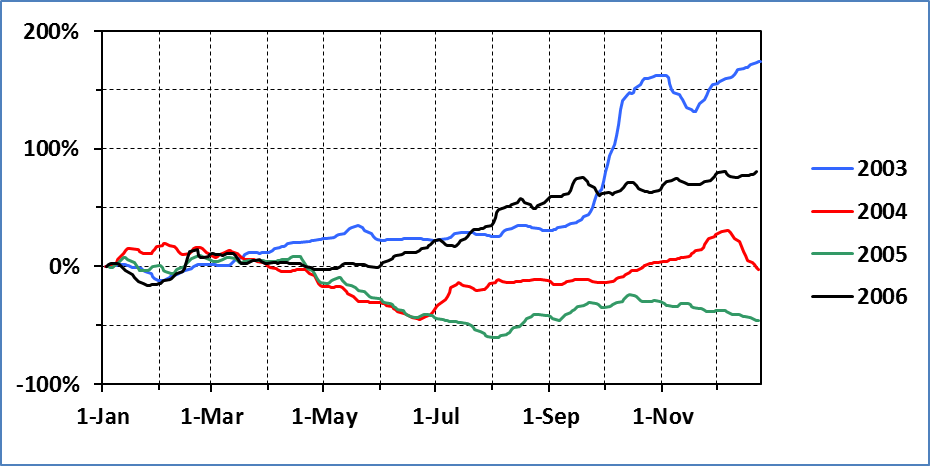
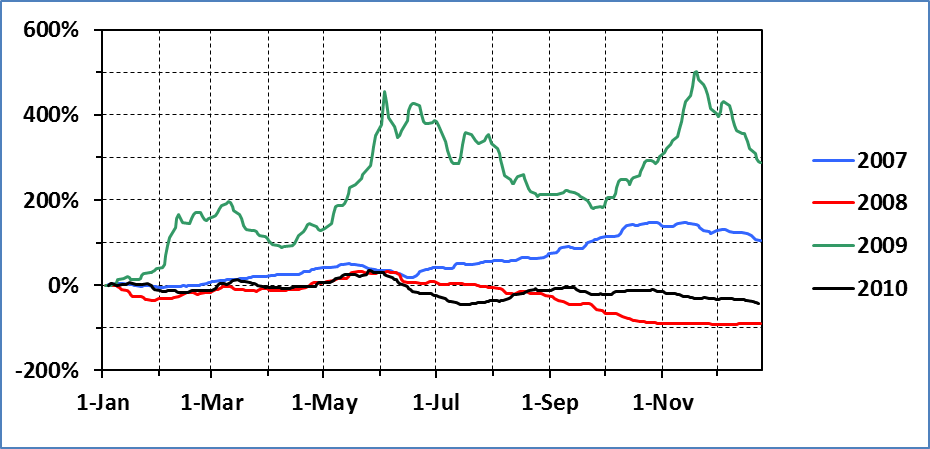

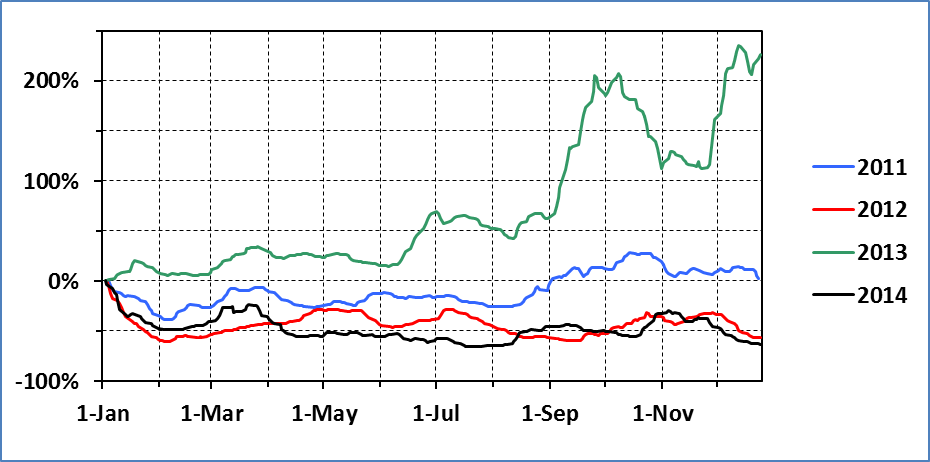
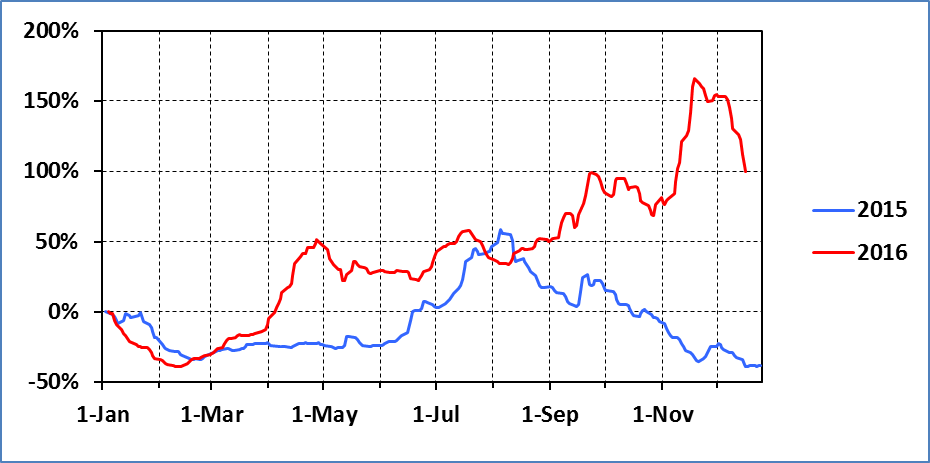
Based on annual opening and
closing values, we define bull market years for the Baltic Dry Index (green)
as those in which the price closed the year > 10% higher than it opened;
bear market years (red) as those in which the price closed the year
>10% lower than it opened; and neutral years (black) as those in which the percentage change was less than 10%:
The Baltic Dry Index has an
average range from the beginning to end of a given year of 94% over the past 14
years.
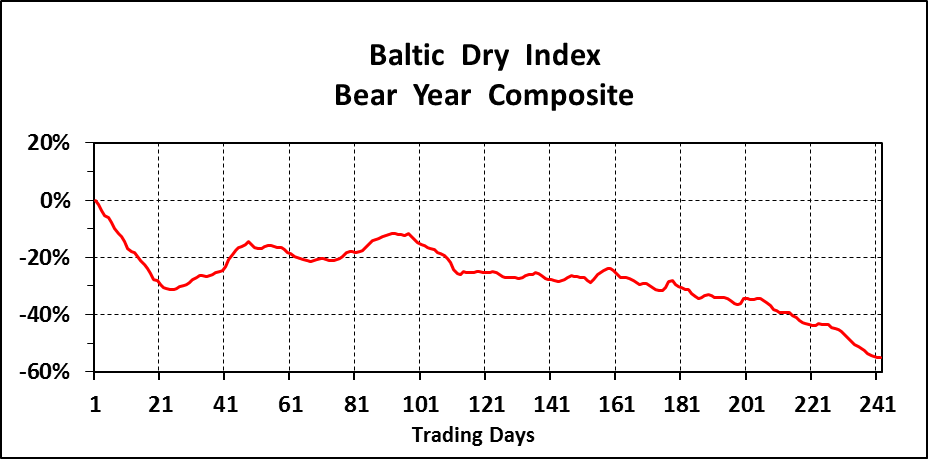
The following three charts
present composite yearly trends from January 1 to December 24 for the entire 14-year
period, six bear years (2005; 2008; 2010; 2012; 2014-2015), and six bull years
(2003; 2006-2007; 2009; 2013; 2016).
We have chosen to disregard
the two neutral years (2004; 2011) as a separate data set because of small
sample size.
Please note the significant change
in y-axis scale for the bull years; its data range is 200% as opposed to 75%
for the overall composite and 55% for bear years:
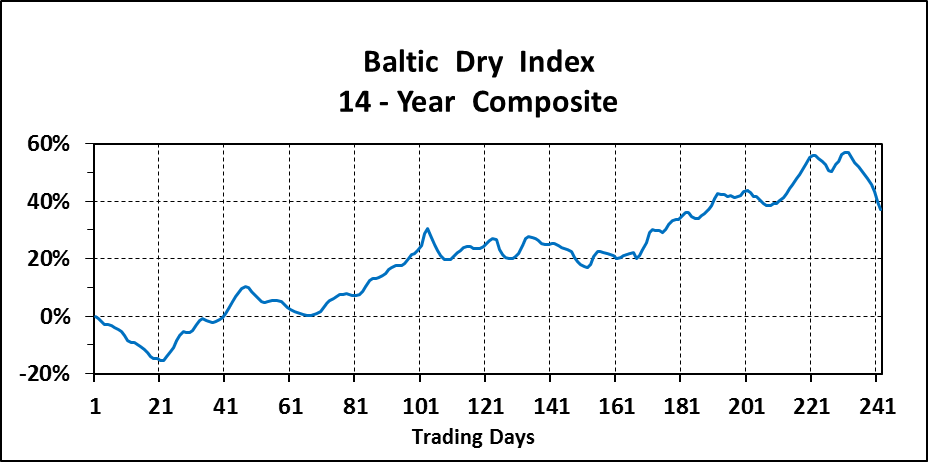
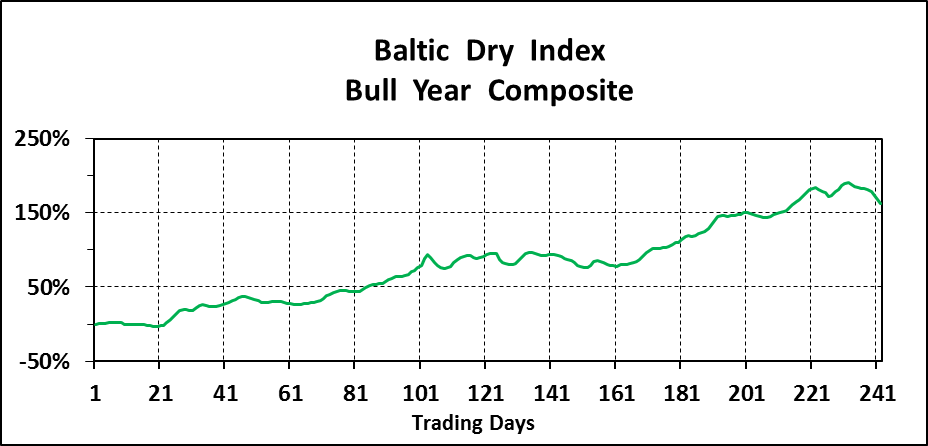
The composite charts
illustrate interesting seasonal trends for the Baltic Dry Index:
-
·
There is a
general fall in the BDI Index from the beginning of January to early February.
It is prominent in the composite and the bear market years while in bull market
conditions, the Index is flat during this period.
-
·
The Index rallies
robustly from early February to early March and then falls off from mid-March
to mid-April regardless of market trend.
-
·
BDI rises in a
steady manner from mid-April until late May (bear market years) or early June
(bull and overall market years).
-
·
In bear years,
the Baltic Dry Index undergoes a steep decline from late May thru mid-June and
then steadies during the early summer. Beginning in late July it undergoes a
steady downtick for the remainder of the year.
-
·
For overall and
bull market composites, the BDI is flat and oscillating during the summer
months. Then it goes mostly higher from mid-September thru early December,
except for a pause in late October to mid-November.
-
·
In all cases,
there is a significant drop-off in the Baltic Dry Index during the second and
third weeks of December. The BDI is not posted from Christmas thru New Year’s.
Now
let’s explore some factors that can account for the well-defined seasonal
trends in the Baltic Dry Index:
-
·
The early January
to early February fall is attributable to wintertime shuttering of some mine
operations and ports and the Chinese New Year when that country shuts down for
about two weeks.
-
·
A rally occurs over
the next month as economic activity in China resumes.
-
·
The mid-April to
early May rise in BDI is likely caused by building of inventories in copper,
timber, steel, and cement in anticipation of peak Northern Hemisphere
construction season.
-
·
In addition, bunker
fuel is costlier in the spring when crude oil prices generally rise as American
refineries ramp up for summer driving season.
-
·
BDI is flat
during the summer months while construction activity uses stockpiled materials.
-
·
Rates tend to
rise from mid-September to late October when grain harvests are shipped and
customers re-stock commodities (especially steel-making materials and thermal
coal) in advance of the Northern Hemisphere winter.
-
·
A lull then occurs
before rates generally move upward again from mid-November thru early December
when China imports more iron ore from Australia and Brazil in advance of their wet
seasons.
-
·
Freight rates drop
as economic activity winds down in North America and Europe in mid- December.
Our research indicates there
is a pronounced seasonality in the Baltic Dry Index over the14 years of
available daily history. This documented seasonality reflects current supply and
demand conditions for the world’s most important metallic, industrial, and
agricultural commodities transported in bulk by cargo ships.
The Index is a leading
economic indicator because it is a predictor of the total cost of raw materials
delivered to customers who produce manufactured goods and pass costs on to
wholesale buyers and then to retail consumers.
The Baltic Dry Index is an
important input that I use to forecast short-term commodity price movements and
macroeconomic trends.
Ciao for now,
Mickey Fulp
Mercenary Geologist
Acknowledgment:
Troy
McIntyre is the research assistant for
MercenaryGeologist.com
.
The
Mercenary
Geologist Michael S. “Mickey” Fulp
is a Certified Professional
Geologist
with a
B.Sc. Earth Sciences with honor from the University of Tulsa, and M.Sc. Geology
from the University of New Mexico. Mickey has 35 years experience as an
exploration geologist and analyst searching for economic deposits of base and
precious metals, industrial minerals, uranium, coal, oil and gas, and water in
North and South America, Europe, and Asia
.
Mickey worked for junior explorers, major
mining companies, private companies, and investors as a consulting economic
geologist for over 20 years, specializing in geological mapping, property
evaluation, and business development. In
addition to Mickey’s professional credentials and experience, he is
high-altitude proficient, and is bilingual in English and Spanish. From 2003 to
2006, he made four outcrop ore discoveries in Peru, Nevada, Chile, and British
Columbia.
Mickey is well-known and highly respected throughout
the mining and exploration community due to his ongoing work as an analyst, writer,
and speaker.
Contact
:
Contact@MercenaryGeologist.com
Disclaimer
and Notice
: I am not a
certified financial analyst, broker, or professional qualified to offer
investment advice. Nothing in any report, commentary, this website, interview,
and other content constitutes or can be construed as investment advice or an
offer or solicitation or advice to buy or sell stock or any asset or
investment. All of my presentations should be considered an opinion and my
opinions may be based upon information obtained from research of public documents
and content available on the company’s website, regulatory filings, various
stock exchange websites, and stock information services, through discussions
with company representatives, agents, other professionals and investors, and
field visits. My opinions are based upon information believed to be accurate
and reliable, but my opinions are not guaranteed or implied to be so. The
opinions presented may not be complete or correct; all information is provided
without any legal responsibility or obligation to provide future updates. I
accept no responsibility and no liability, whatsoever, for any direct,
indirect, special, punitive, or consequential damages or loss arising from the
use of my opinions or information. The information contained in a report, commentary,
this website, interview, and other content is subject to change without notice,
may become outdated, and may not be updated. A report, commentary, this
website, interview, and other content reflect my personal opinions and views
and nothing more. All content of this website is subject to international
copyright protection and no part or portion of this website, report,
commentary, interview, and other content may be altered, reproduced, copied,
emailed, faxed, or distributed in any form without the express written consent
of Michael S. (Mickey) Fulp, MercenaryGeologist.com LLC.
Copyright © 2016
Mercenary Geologist.com, LLC. All Rights Reserved.