A Monday Morning Musing from Mickey the
Mercenary Geologist
Contact@MercenaryGeologist.com
January 4, 2016
My recent work has focused on
seasonality of the gold price (Mercenary
Musings: October 19; October 26; November 23). Today, I
present new research covering a 20-year time frame from 1996-2015 that includes
a 12-year bull market for gold from 2001-2012 bracketed by bear markets in the
late 1990s and mid-2010s.
In a series of normalized
charts, I will show that regardless of overall year-over-year bull or bear
market conditions, there are predictable intra-year trends in the gold price.
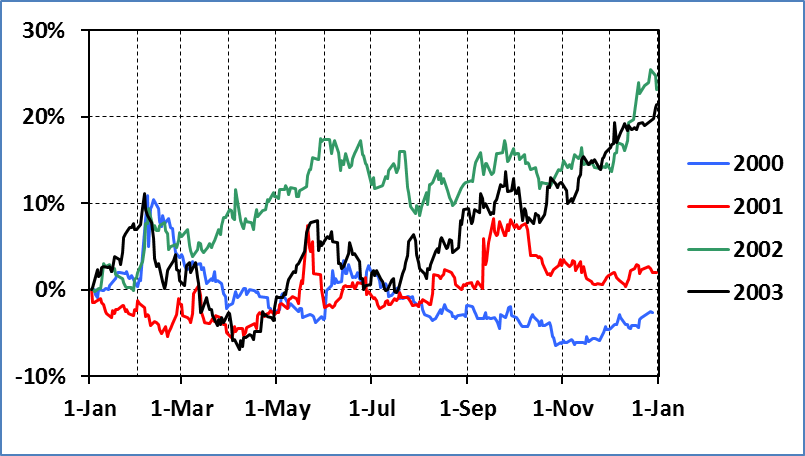
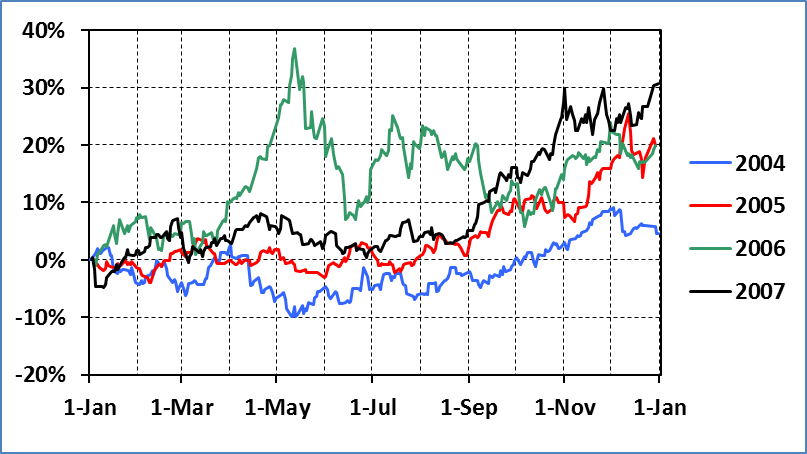
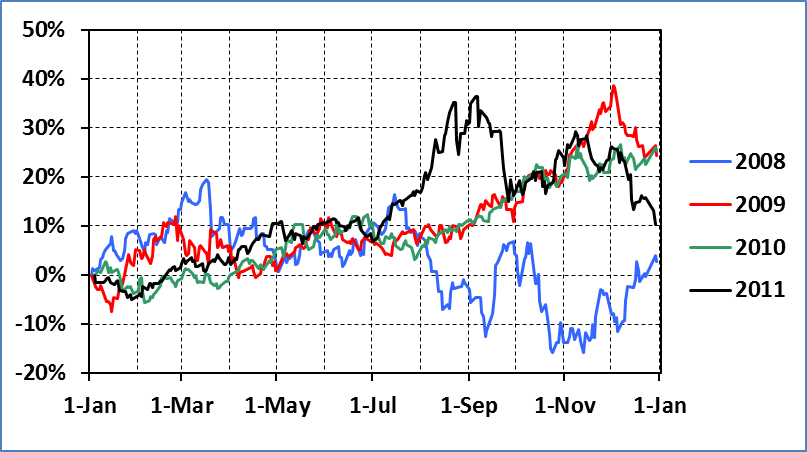
The first series of charts shows the percentage change
in the daily gold price normalized to January 1 for each year from 1996 to
2015. Please note that all gold prices are London afternoon close:
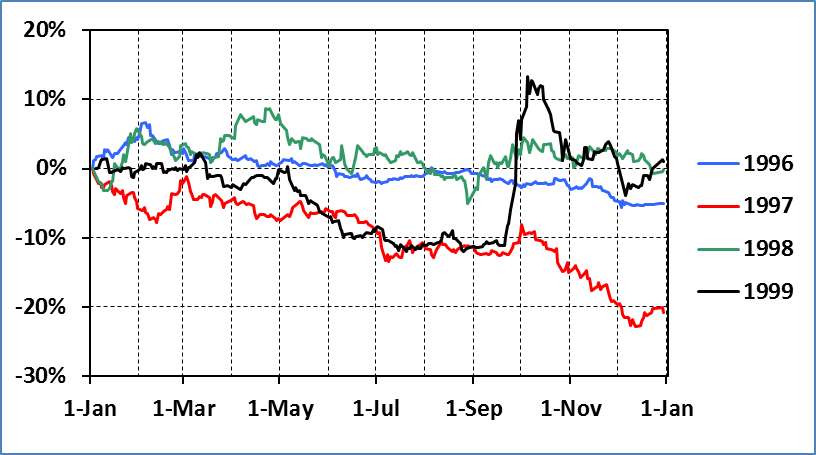
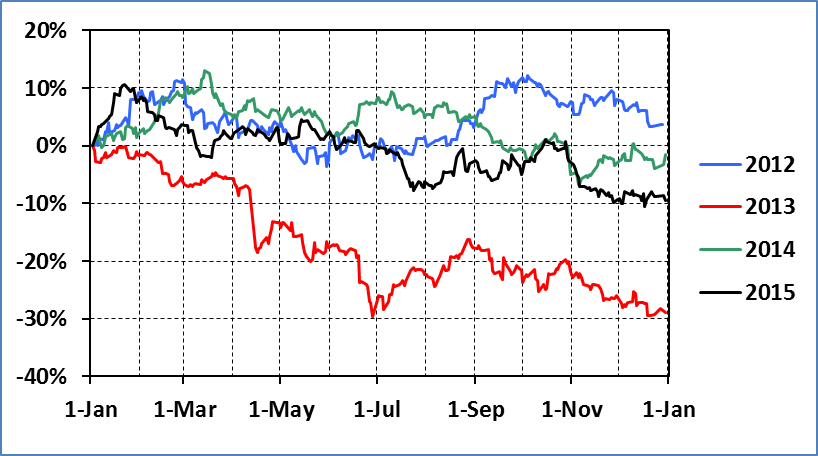
Based on data tabulated
below, we define bull years for gold (black)
as those in which the price closed the year higher than it opened and bear
market years (red)
as those in which the price closed the year lower than it opened. In 1998, gold
closed the year 40 cents lower so the percentage change rounds off to zero:
Gold $ / Oz
|
Year
|
Jan Open
|
Dec Close
|
% Change
|
|
1996
|
394
|
369
|
6.3
|
|
1997
|
359
|
290
|
19.2
|
|
1998
|
288
|
288
|
0.0
|
|
1999
|
287
|
291
|
1.4
|
|
2000
|
282
|
274
|
2.8
|
|
2001
|
271
|
277
|
2.2
|
|
2002
|
278
|
347
|
24.8
|
|
2003
|
344
|
416
|
19.1
|
|
2004
|
416
|
436
|
4.8
|
|
2005
|
428
|
513
|
19.9
|
|
2006
|
530
|
632
|
19.2
|
|
2007
|
640
|
834
|
30.1
|
|
2008
|
847
|
870
|
2.6
|
|
2009
|
875
|
1088
|
24.3
|
|
2010
|
1122
|
1406
|
25.3
|
|
2011
|
1389
|
1531
|
10.2
|
|
2012
|
1598
|
1658
|
3.8
|
|
2013
|
1694
|
1205
|
28.9
|
|
2014
|
1225
|
1206
|
1.6
|
|
2015
|
1172
|
1061
|
9.4
|
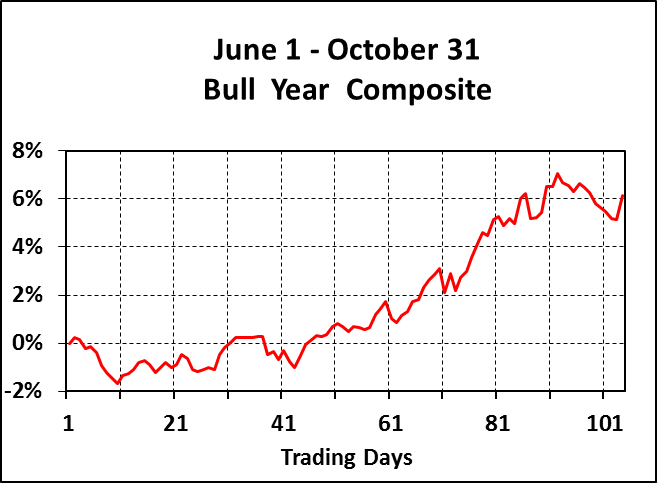
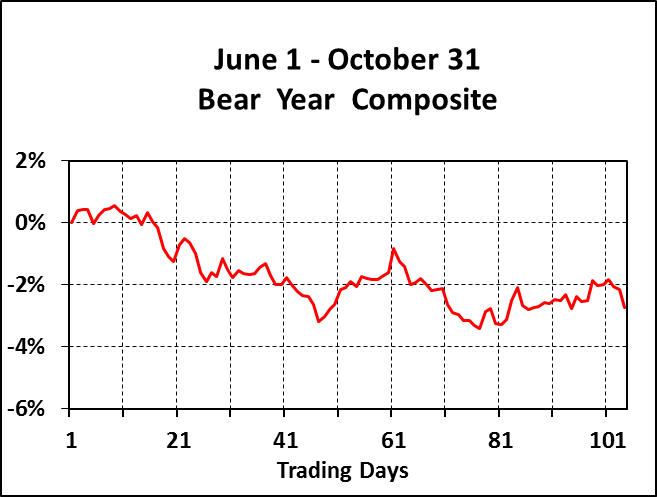
The following three charts
present composite seasonal trends from June 1 to October 31 for the entire
20-year period, bear years (1996-1998; 2000; 2013-2015) and bull years (1999;
2001-2012):
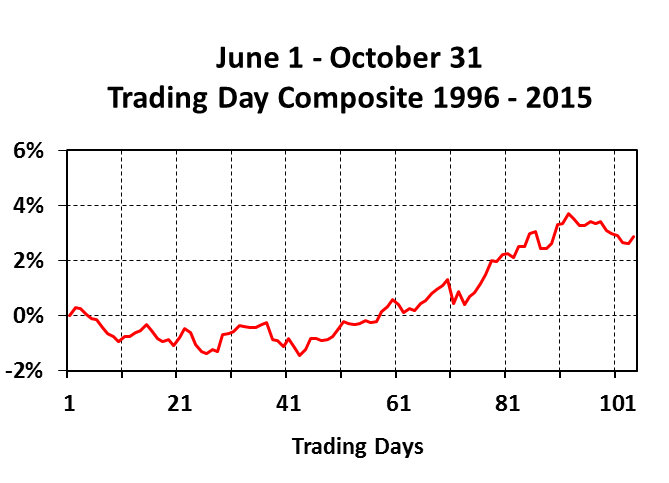
The 20-year composite chart
expands upon the seasonal trend documented in a previous missive (Mercenary Musing, October 26):
an early June 1 high followed by lows during the summer doldrums with a
mid-August rally that continues through mid-October. Separating bear and bull
cases shows some interesting divergence. In bull market years, the summer
doldrums begin earlier and are less pronounced and gold goes on the uptick by
early August. In bear markets, the August rally is short-lived to Labor Day and
the October rise is choppy and of less magnitude.
Next up is the second
seasonal period from November 1 to January 31 that we considered previously (Mercenary Musing November 23).
Here are the composite 20-year, bull market, and bear market charts:
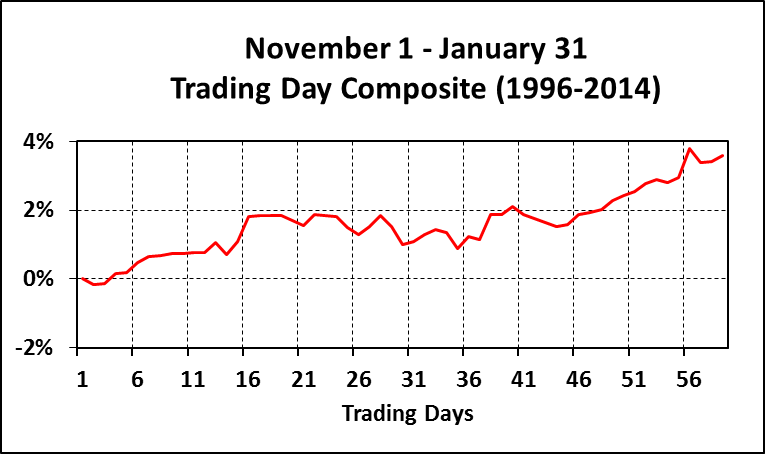
For the 20-year composite, the
gold price trend is mostly up. Gold goes higher thru late November as physical
demand peaks, trades flat thru the holidays, and rallies strongly for most of
January.
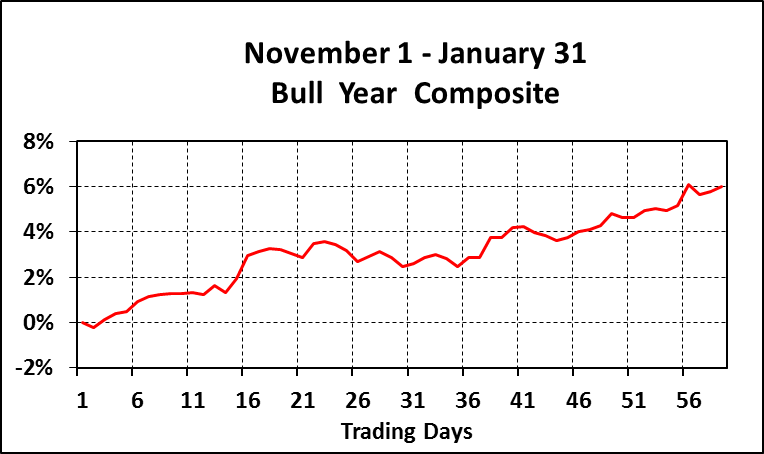
If we examine bull and bear
cases independently, the patterns are once again significantly different. In
bull market years, the gold price mimics the overall trend but the amplitudes are
much higher (note y- axis scale change).
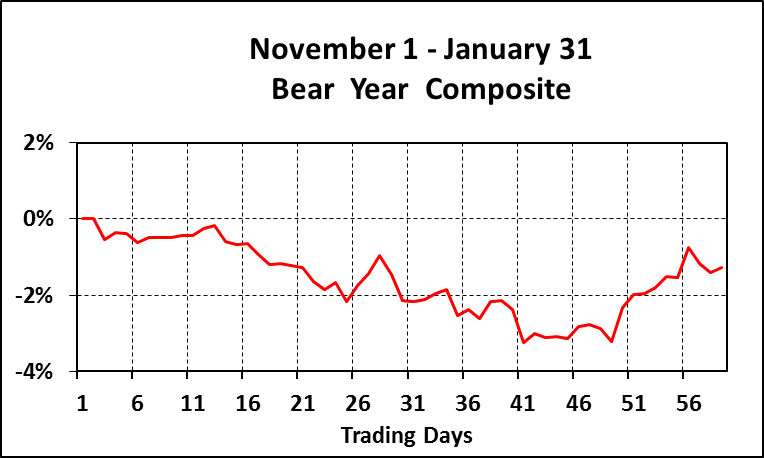
In bear years, the gold price
falls in November thru early January with a notable price spike in early
December. The seasonal rally does not begin until end of the second week of the
new year and though muted in amplitude, remains intact for the remainder of the
month.
Let’s review:
·
Over a 20-year
time frame, there is an intra-year seasonality of the gold price from June 1 to
October 31 and November 1 to January 31.
·
From June 1 to
October 31, gold reaches a seasonal low during the summer doldrums and rallies after
Labor Day and thru most of October.
·
From November 1
to January 31, gold rises in bull and falls in bear markets during November and
December, and rallies strongly in January in both cases.
·
Although there
are notable differences in timing and amplitude of rises or falls in the gold
price during bull and bear market years, overall seasonal trends occur no
matter the prevailing market conditions.
Here’s a composite price
chart that can be used to time buys and/or sells of gold:
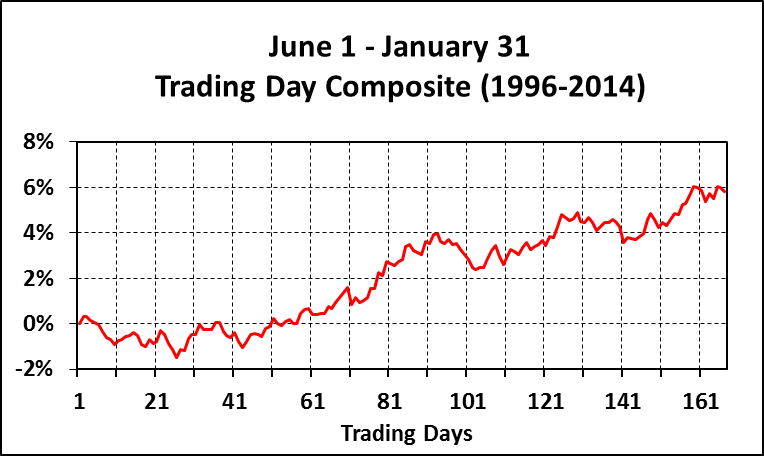
In conclusion:
·
Speculators and
traders should buy paper gold and derivatives during the summer doldrums and sell
in late January of the following year.
·
Hoarders (like
me) who accumulate gold as real money, a safe haven, and an insurance policy against
financial calamity, should buy physical gold during the summer doldrums of any
given year.
Ciao for now,
Mickey Fulp
Mercenary Geologist
Acknowledgment: Steve Sweeney is the research assistant for MercenaryGeologist.com and compiled the data and charts.
The Mercenary
Geologist Michael S. “Mickey” Fulp
is a Certified Professional Geologist with a
B.Sc. Earth Sciences with honor from the University of Tulsa, and M.Sc. Geology
from the University of New Mexico. Mickey has 35 years experience as an
exploration geologist and analyst searching for economic deposits of base and
precious metals, industrial minerals, uranium, coal, oil and gas, and water in
North and South America, Europe, and Asia.
Mickey worked for junior explorers, major
mining companies, private companies, and investors as a consulting economic
geologist for over 20 years, specializing in geological mapping, property
evaluation, and business development. In
addition to Mickey’s professional credentials and experience, he is
high-altitude proficient, and is bilingual in English and Spanish. From 2003 to
2006, he made four outcrop ore discoveries in Peru, Nevada, Chile, and British
Columbia.
Mickey is well-known and highly respected throughout
the mining and exploration community due to his ongoing work as an analyst, writer,
and speaker.
Contact: Contact@MercenaryGeologist.com
Disclaimer
and Notice: I am not a
certified financial analyst, broker, or professional qualified to offer
investment advice. Nothing in any report, commentary, this website, interview,
and other content constitutes or can be construed as investment advice or an
offer or solicitation or advice to buy or sell stock or any asset or
investment. All of my presentations should be considered an opinion and my
opinions may be based upon information obtained from research of public
documents and content available on the company’s website, regulatory filings,
various stock exchange websites, and stock information services, through
discussions with company representatives, agents, other professionals and
investors, and field visits. My opinions are based upon information believed to
be accurate and reliable, but my opinions are not guaranteed or implied to be
so. The opinions presented may not be complete or correct; all information is
provided without any legal responsibility or obligation to provide future
updates. I accept no responsibility and no liability, whatsoever, for any direct,
indirect, special, punitive, or consequential damages or loss arising from the
use of my opinions or information. The information contained in a report,
commentary, this website, interview, and other content is subject to change
without notice, may become outdated, and may not be updated. A report,
commentary, this website, interview, and other content reflect my personal
opinions and views and nothing more. All content of this website is subject to
international copyright protection and no part or portion of this website,
report, commentary, interview, and other content may be altered, reproduced,
copied, emailed, faxed, or distributed in any form without the express written
consent of Michael S. (Mickey) Fulp, MercenaryGeologist.com LLC.
Copyright © 2016
Mercenary Geologist.com, LLC. All Rights Reserved.